
读图:同一年、同一总体、五种方式
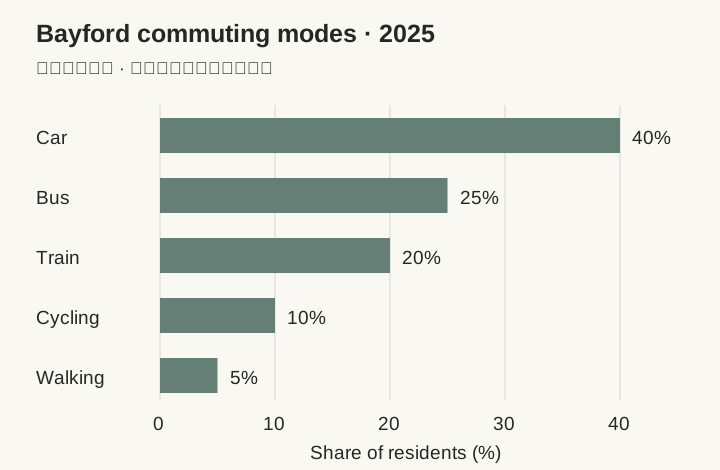
图表表示 2025 年 Bayford 居民主要通勤方式的占比:汽车 40%、公交 25%、火车 20%、骑行 10%、步行 5%,合计 100%。这是同年各类别的横向比较,适合写 accounted for、was higher than、was twice the share of。
雅思小作文静态图比较同一时间点的各个类别:先看谁领先、哪些类别接近,再挑一组有意义的差距。本例把五个比例写成两组信息和清晰的比较句。
跳到本页练习,先自己写两句,再展开答案对照。
正在打开题目
图表表示 2025 年 Bayford 居民主要通勤方式的占比:汽车 40%、公交 25%、火车 20%、骑行 10%、步行 5%,合计 100%。这是同年各类别的横向比较,适合写 accounted for、was higher than、was twice the share of。
先圈出单项最高的汽车 40%,再把相近的数值分成组。
Overall, cars were the most common individual commuting mode, while walking was the least common. Bus and train travel together accounted for a larger share than cars, whereas cycling and walking made up a relatively small proportion. 这两句分别交代单项首尾、公共交通合计与较小组。individual 限定“汽车最高”的比较范围,together 说明公共交通是两项合计。
汽车 40% 与火车 20%:相减是 20 个百分点,相除是 2 倍。
Cars accounted for 40% of commuters, making them the largest individual category. Buses were used by a quarter of residents, while trains represented a further 20%. Together, these two forms of public transport made up 45%, five percentage points more than the figure for cars. Cycling and walking had smaller shares, at 10% and 5% respectively. The proportion cycling was twice that walking, and the two modes together accounted for 15% of commuters. The largest gap between individual categories was 35 percentage points, separating cars from walking. 第一段比较汽车与公交、火车,第二段处理两个较小类别并量化最大差距。这里的先后是报告顺序,全部数据都属于 2025 年。
换一座城市(汽车 30%、公交 30%、火车 20%、骑行 15%、步行 5%),写一句最高项概括,再写一句骑行与步行的差距和倍数。先自己写,再展开答案对照。
用本页练习的新数据独立完成,再展开答案核对最高项、百分点与倍数。