
读图:先把对象、单位和关系写在一起
两图共享 2025 年和三家图书馆:柱图给到访规模(千次),表格给到访目的构成(%)。
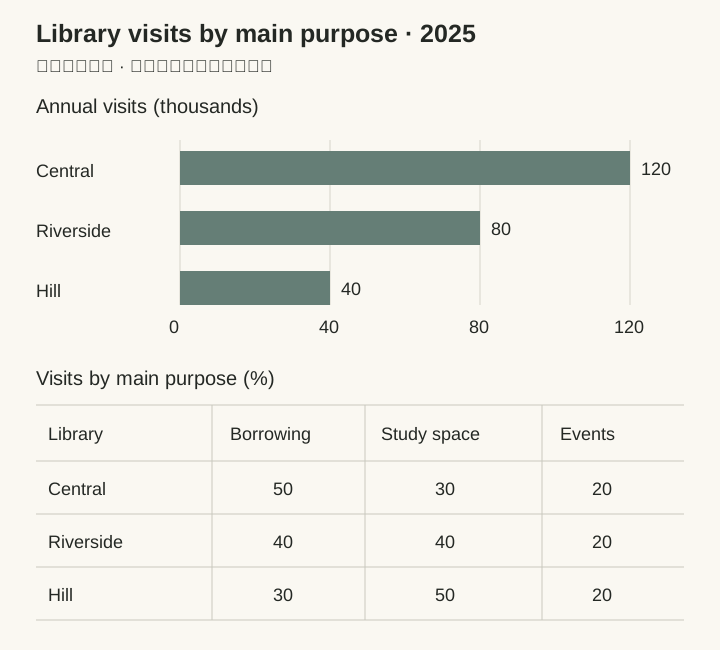
- 柱图:Central、Riverside、Hill 的年到访量。
- 表格:各馆每次到访的主要目的,每行合计 100%。
- 每次到访记一个主要目的,占比以该馆总到访次数为分母。
先找两图共享的对象与时间,再分别概括各图的主要特征。本例用同一年三家图书馆的到访量与到访目的占比,演示从读图到完整报告的过程。
登录后免费开始「雾港来信」第一关:在一组通勤双图里挑事实,写 1–2 句。
正在打开题目
两图共享 2025 年和三家图书馆:柱图给到访规模(千次),表格给到访目的构成(%)。
每张图挑一个最醒目的整体判断:柱图是规模排名,表格是构成差异。
Overall, Central recorded the most visits, while Hill had the fewest. Borrowing was the leading purpose of visits at Central, whereas study space accounted for the largest share at Hill; events represented an equal proportion at all three libraries.
本例按指标分段:第一段比较三馆规模,第二段比较到访目的构成。
The bar chart compares the number of visits to three libraries in 2025, while the table shows the percentage of visits made primarily for borrowing, study space or events at each location. Overall, Central recorded the most visits, while Hill had the fewest. Borrowing was the leading purpose of visits at Central, whereas study space accounted for the largest share at Hill; events represented an equal proportion at all three libraries. Central received 120,000 visits during the year, compared with 80,000 at Riverside and 40,000 at Hill. Its figure was therefore three times that of Hill, and the gap between each pair of neighbouring libraries in the ranking was 40,000 visits. At Central, borrowing was the main purpose of half of all visits, while study space accounted for 30%. Riverside had equal shares for these two purposes, at 40% each. At Hill, study space accounted for 50% of visits and borrowing accounted for 30%, reversing Central’s pattern. Events represented the remaining 20% at every library.
四段各做一件事,每个数字关系都能从图里算出来。
选出适合本题概述的两项,再写一句规模概括和一句构成概括。先自己写,再展开答案对照。
登录后开始「雾港来信」第一关:换一组通勤双图,先练挑事实、写 1–2 句。